


In any database, as your data and traffic grow, you should start monitoring performance, costs, and latency. Many Azure Cosmos DB users lack a dedicated DBA resource in their companies. One advantage of NoSQL databases is that they don’t require a schema or a DBA, which can slow down development. Sooner or later, you’ll see that having a DBA isn’t a bad idea, but neither is learning how to address Cosmos DB performance issues and becoming an Azure Cosmos DB SME in your company.
If you’re facing issues such as hot partitioning, expensive queries, or latency problems, Azure Cosmos DB Diagnostics can help you understand the underlying causes. Diagnostic logs function like engine code readers, allowing you to connect to your car and diagnose the reason for the engine light on your dashboard.
You need to set them up by using the Monitoring > Diagnostic Settings link.
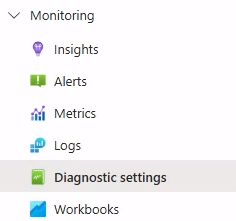
You will see the Add diagnostic setting link when you click on the Diagnostic settings. Follow the steps in the screenshot below to complete the setup.
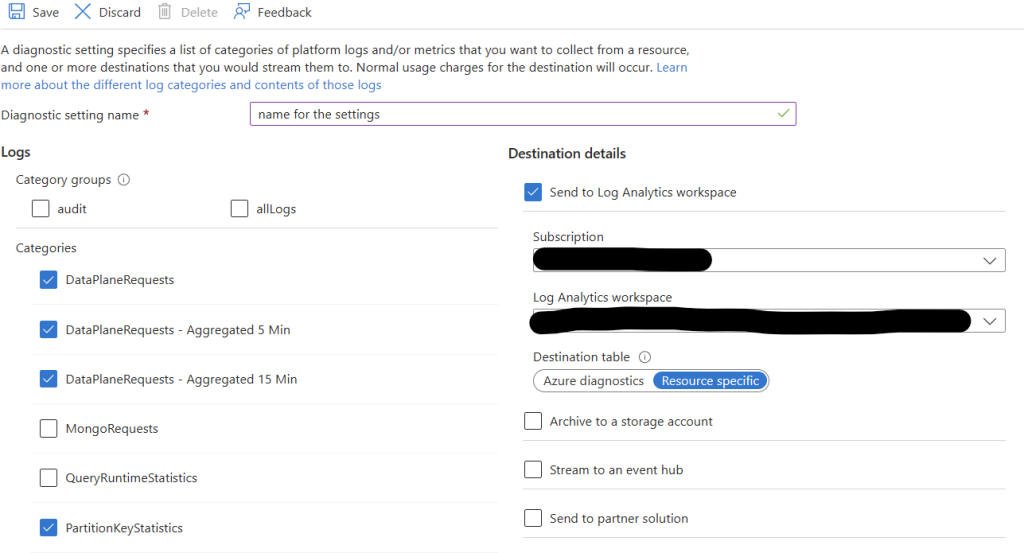
The destination table indicates where logs are stored. Azure Diagnostics, now outdated, stores all logs in a single shared table. Meanwhile, resource-specific stores separate data into individual tables for each service.
Azure Diagnostics is slower because it is complex and has a wide table. Also, you cannot restrict access at the table level. If the user has access, all data from different services can be read. Resource-Specific is a better option because each resource has its own table. It is faster because it is specific to a resource. It is much cleaner and more predictable.
The following categories are available for SQL API.
The DataPlaneRequests(CDBDataPlaneRequests) category contains all data-plane operations executed against your Cosmos DB account. It captures raw per-request granular logs. This is great for immediate troubleshooting or auditing, but it can get expensive since it captures every data request. You can use this log to identify Expensive Operations, Slow queries, Throttling(429) issues, Latency problems, payload size issues, hot partitions, and any error trends.
The CDBDataPlaneRequests5M provides the exact same operational insights as the CDBDataPlaneRequests, but summarizes its data into 5-minute intervals. You might lose the ability to see each user’s transactions, but you reduce log ingestion costs by up to 95% by selecting this version. You can use this log to identify Throttling Spikes, Traffic Surge Timelines, Total RU Burn Rate, Total Server Execution Time, and many more insights.
The CDBDataPlaneRequests15M aggregates data plane requests into 15-minute intervals. It offers the highest cost savings and provides a high-level and long-term view of your database health. You can use this log to identify peak usage hours, systematic failure waves, top billing operations, and any workload shifting. This is a great option for executive dashboards, monthly capacity reports, and historical trend analysis. It is not very useful for any real-time debugging.
The PartitionKeyStatistics(CDBPartitionKeyStatistics) diagnostic logs help you identify the largest logical partition keys and track the distribution of throughput. While CDBDataPlaneRequests diagnostics logs monitor compute and throughput, CDBPartitionKeyStatics tracks storage sizes of logical partition keys. You can easily find out if any of your logical partitions are close to the logical partition limit (20 GB) or which logical partition keys cause hot partitioning.
The PartitionKeyRUConsumption(CDBPartitionKeyRUConsumption) diagnostic logs provide Request Unit Consumption of logical partition keys in a physical partition. You can use these logs to find which logical partition costs you the most. Data in this log tells you exactly which data are causing traffic spikes and driving up your bill. If you have a multi-tenant system, this diagnostics log can tell you which tenant is responsible for the largest portion of your monthly bill.
Leave a Reply